El Niño — ocean and climate
El Niño is part of the variability of the tropical ocean–atmosphere system. Here we explain its mechanisms, teleconnections and significance for rainfall, floods and the economy.
Pacific temperatures compared with previous years
Let us look at how Pacific temperatures this year compare with those in previous years.
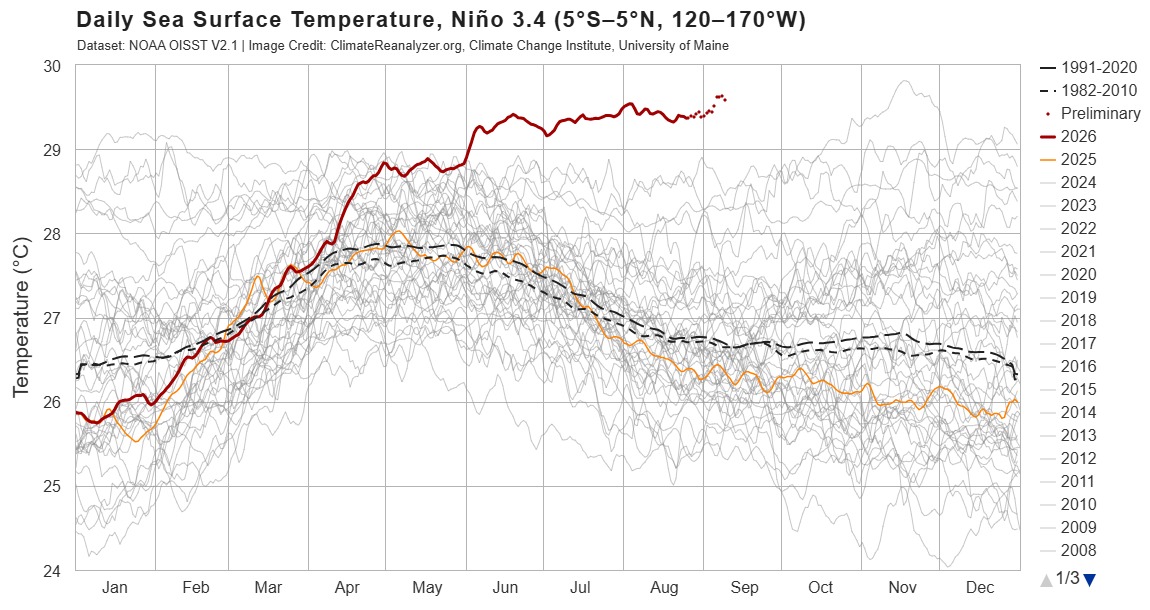
Each line shows temperatures through the year. Comparing the same month helps distinguish the typical seasonal cycle from differences between years. This chart shows temperature in °C; the map below shows temperature anomalies.
The year 2026 stands out for exceptionally high temperatures in the equatorial Pacific. Warming is especially pronounced in its eastern part and accompanies a strengthening El Niño. According to NOAA’s statement of 10 September 2026 the probability of a very strong episode in autumn and winter 2026/27 exceeds 90%. We explain how the ocean and atmosphere interact, how changes in the tropical Pacific affect weather in distant regions, and why they matter for rainfall, floods, fisheries and the economy.
Sea-surface temperature anomalies
A temperature anomaly is the difference between the temperature on a given day and its reference average.
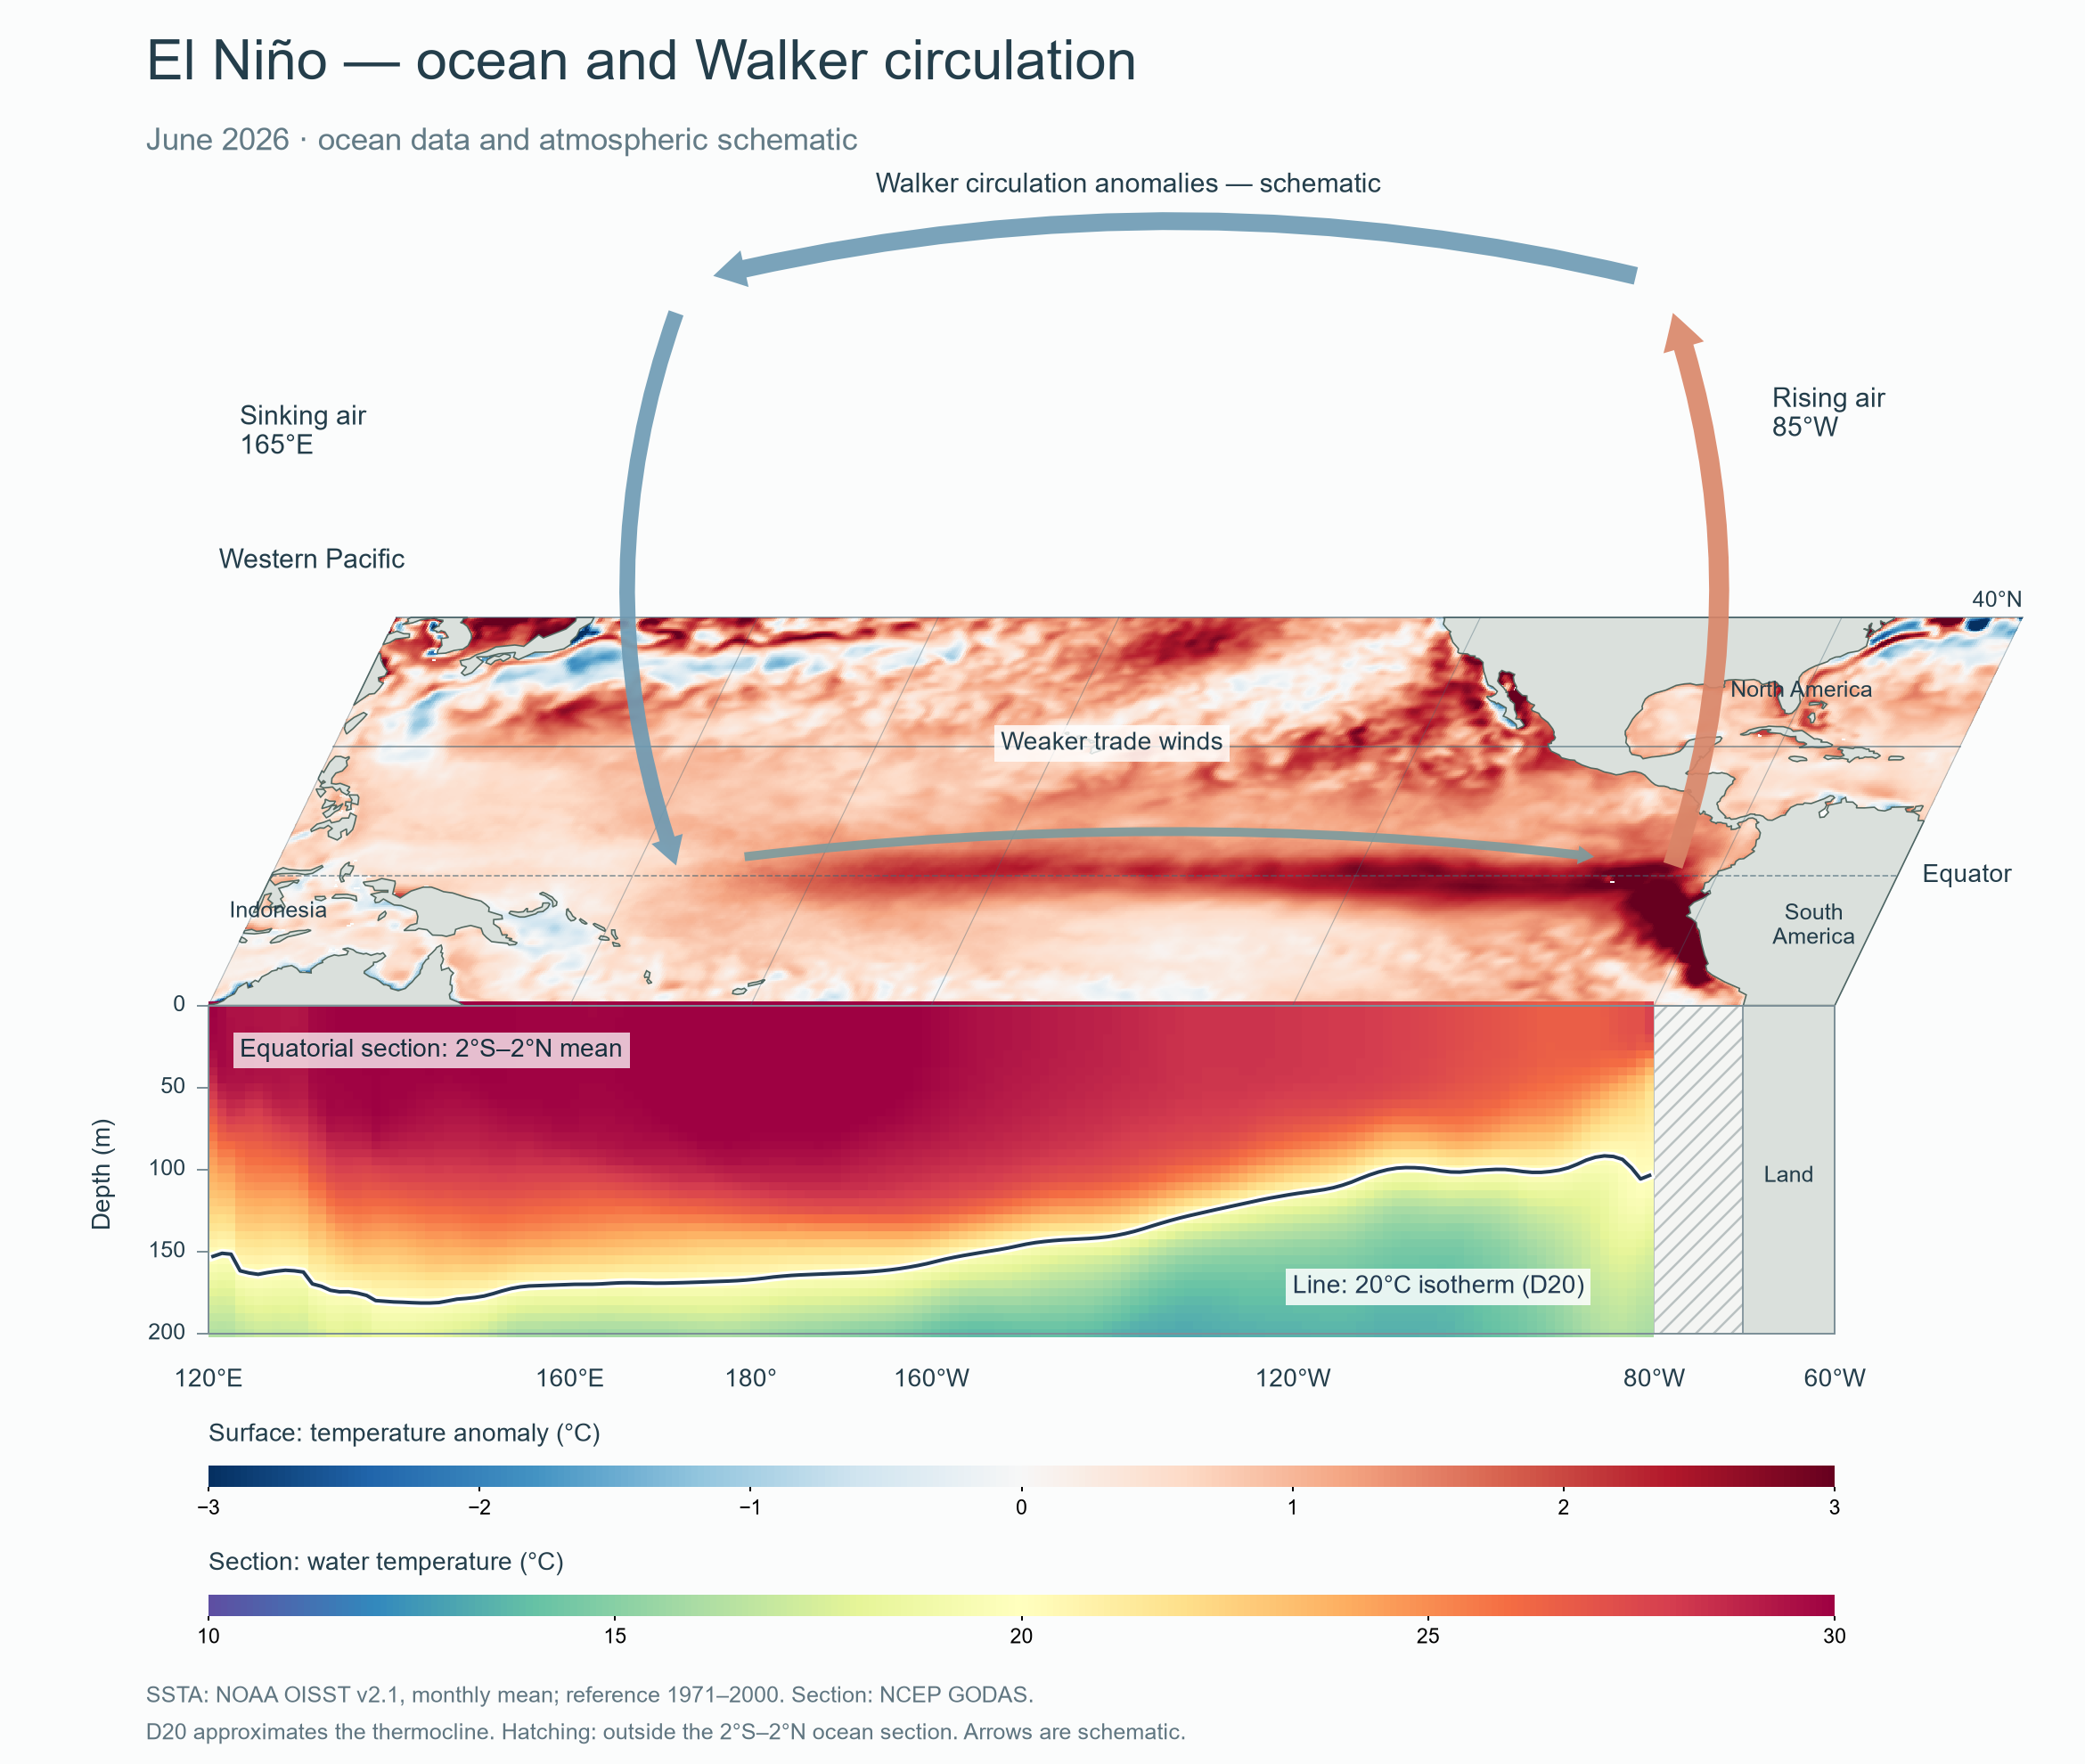
The daily sea-surface temperature chart shows changes over time, while the globe shows their geographical extent. Notice the band of warmer-than-average water along the equator, reaching the coast of South America.
PIOTR J. FLATAU · NAUKA O KLIMACIE
How does a satellite measure ocean temperature?
Satellite SST maps result from measuring radiation and interpreting those measurements. Piotr J. Flatau explains in his article published in Nauka o klimacie:
“Estimates of ocean temperature from satellite measurements are not direct measurements.”
Direct measurement: a bucket of water and a thermometer
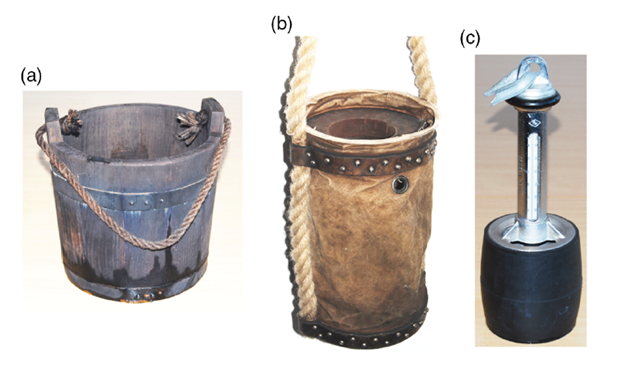
Before satellites, water was collected from ships in a bucket or sampler and a thermometer was immersed in it. This simple method provided fairly long observation records, but the water temperature could change before it was read. Evaporation, sunlight, wind, the container material and the delay between collection and reading all matter. A sample can cool or warm. These differences in measurement methods must be considered when comparing historical and modern observations.
Satellite sensors detect infrared or microwave radiation. Temperature is estimated using algorithms that account for surface properties and atmospheric effects. The results must be compared with direct measurements.
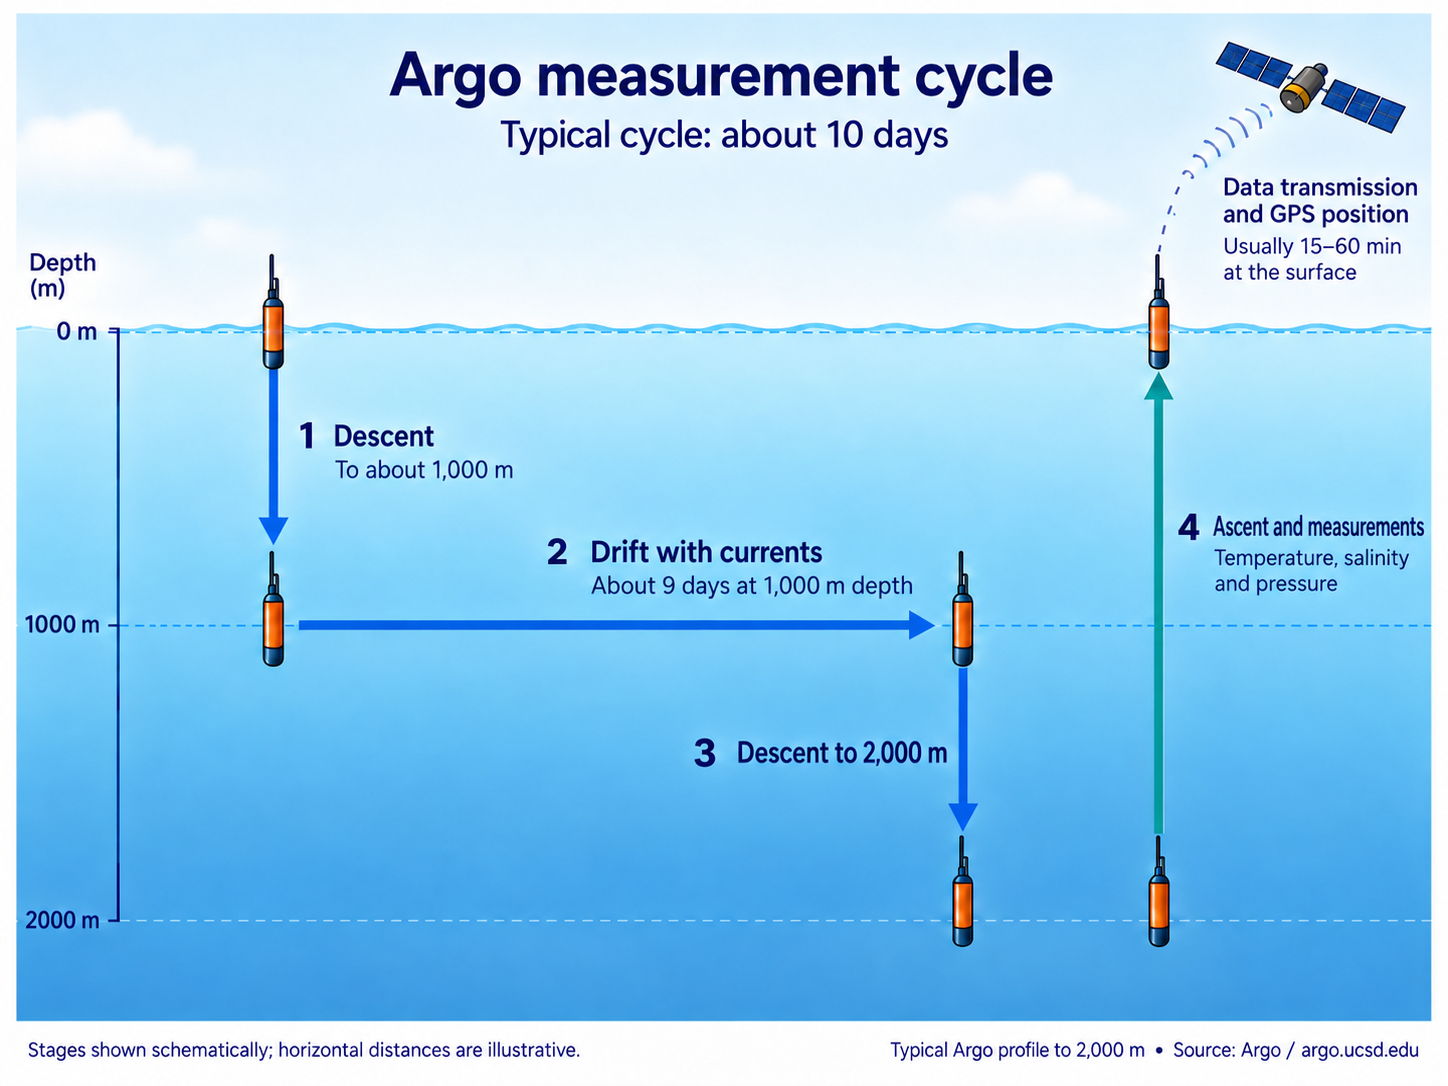
Clouds affect infrared measurements of ocean temperature. Microwaves can observe the ocean through cloud layers, although rain can interfere with the signal. Both types of observation have limitations and their own resolution. Infrared measurements describe the ocean’s very thin skin; microwaves sample a layer about a millimetre deep. A satellite measurement is therefore not simply the water temperature a few metres below the surface. Satellite observations are complemented by autonomous Argo floats that measure temperature and salinity at different depths. This reveals the ocean’s vertical structure, which an SST map alone cannot show.
ENSO: coupling between ocean and atmosphere
El Niño is the warm phase of ENSO, an oscillation involving changes in tropical Pacific temperatures. These variations depend on interactions between the ocean, winds and rainfall.
During La Niña, trade winds move warm surface water towards the western equatorial Pacific. Intense convection and clouds develop over the warmer ocean. Near the surface, air flows from east to west, rises over the western Pacific and returns eastward in the upper troposphere. This cycle is called the Walker circulation.

During El Niño, the trade winds weaken. Warm water and the associated zone of intense convection extend farther east, while the upwelling of cold water towards the surface weakens. Ocean temperature changes affect the atmosphere, which in turn sustains changes in ocean conditions. ENSO is therefore described as a coupled phenomenon.
El Niño and tropical cyclones in the Atlantic
One of the most important examples of El Niño’s influence on weather far beyond the tropical Pacific is its effect on tropical cyclones and hurricanes in the Atlantic. William M. Gray of Colorado State University described this mechanism in a 1984 paper. Gray demonstrated a relationship between moderate and strong El Niño episodes and a reduced number of tropical cyclones in the Atlantic.
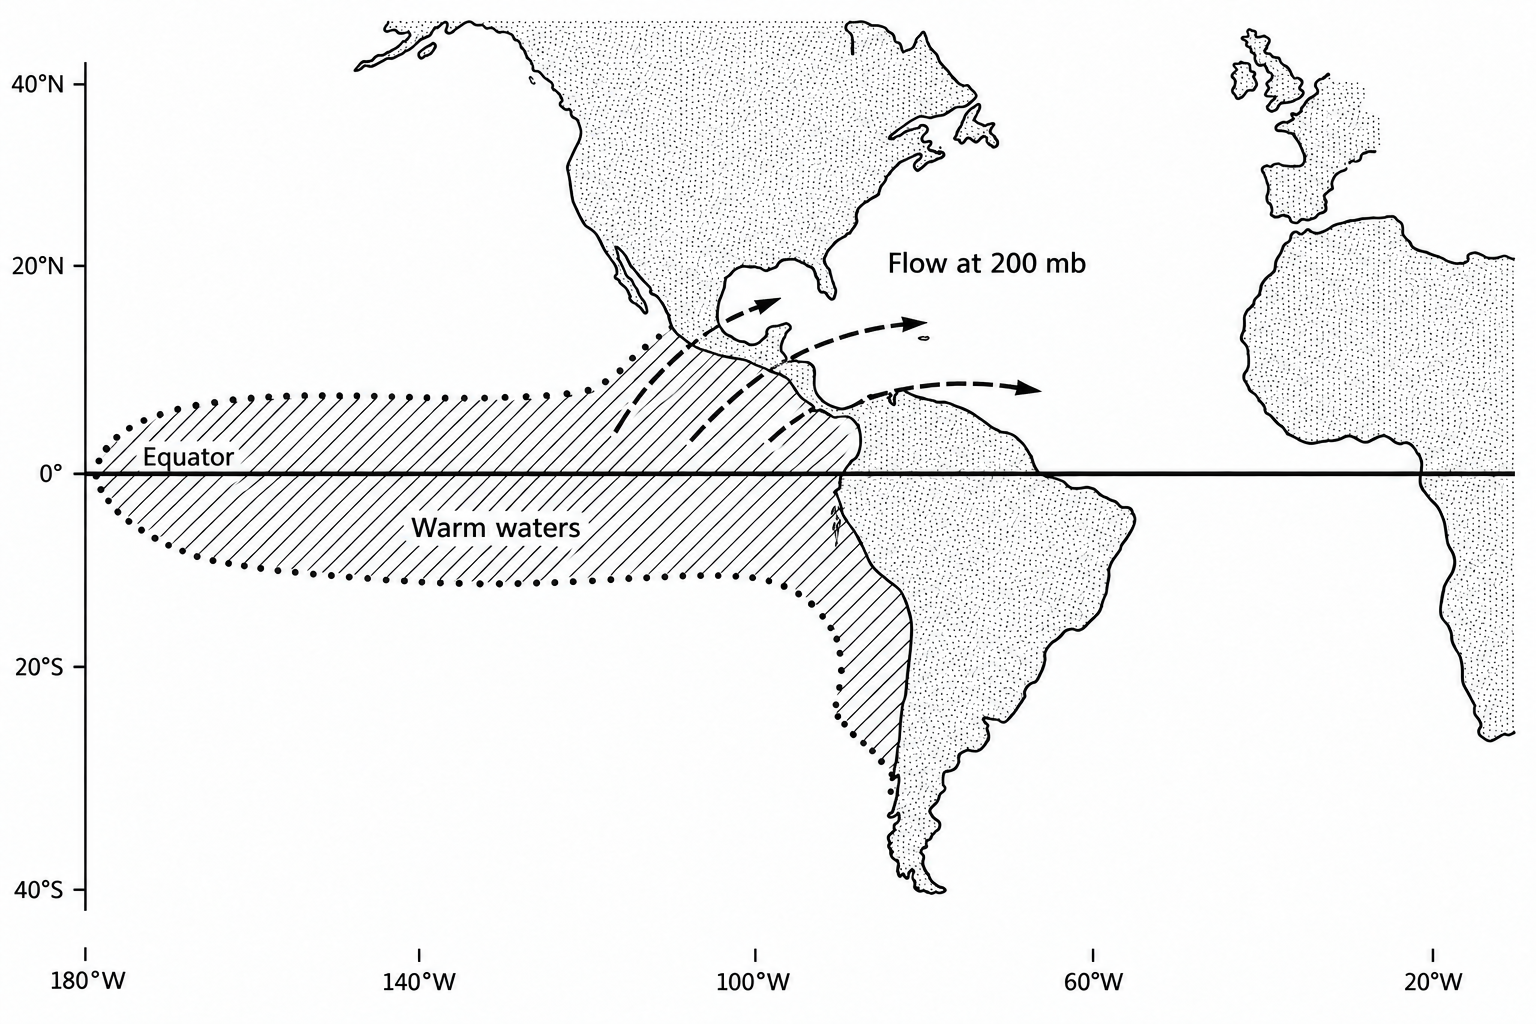
During El Niño, the area of very warm water extends eastward along the equatorial Pacific. The region of deep convection shifts with it. Air in convective clouds rises into the upper troposphere and then spreads out near the 200 hPa level, roughly 12 km above the surface. In his lectures, Gray called the 200 mb level LID (“lid”), short for Level of Insignificant Dynamics. One consequence of this circulation change is stronger westerly winds in the upper troposphere over the Caribbean Sea and tropical Atlantic. Meanwhile, in the lower troposphere near 850 hPa, about 1.5 km above the surface, the trade winds continue to blow from east to west, increasing the difference between the upper- and lower-tropospheric winds:
ΔV = |V200 − V850|
V₂₀₀ and V₈₅₀ denote wind vectors. The magnitude of the difference, ΔV, measures the vertical difference in wind speed between the lower and upper troposphere. This difference makes it harder for a developing tropical cyclone to maintain a vertically organised structure—figuratively, it “blows the cyclone apart”. Gray also emphasised that during El Niño, upper-tropospheric circulation over the Atlantic becomes less anticyclonic and therefore less favourable for cyclone formation and maintenance.
The geographical distribution of ENSO impacts
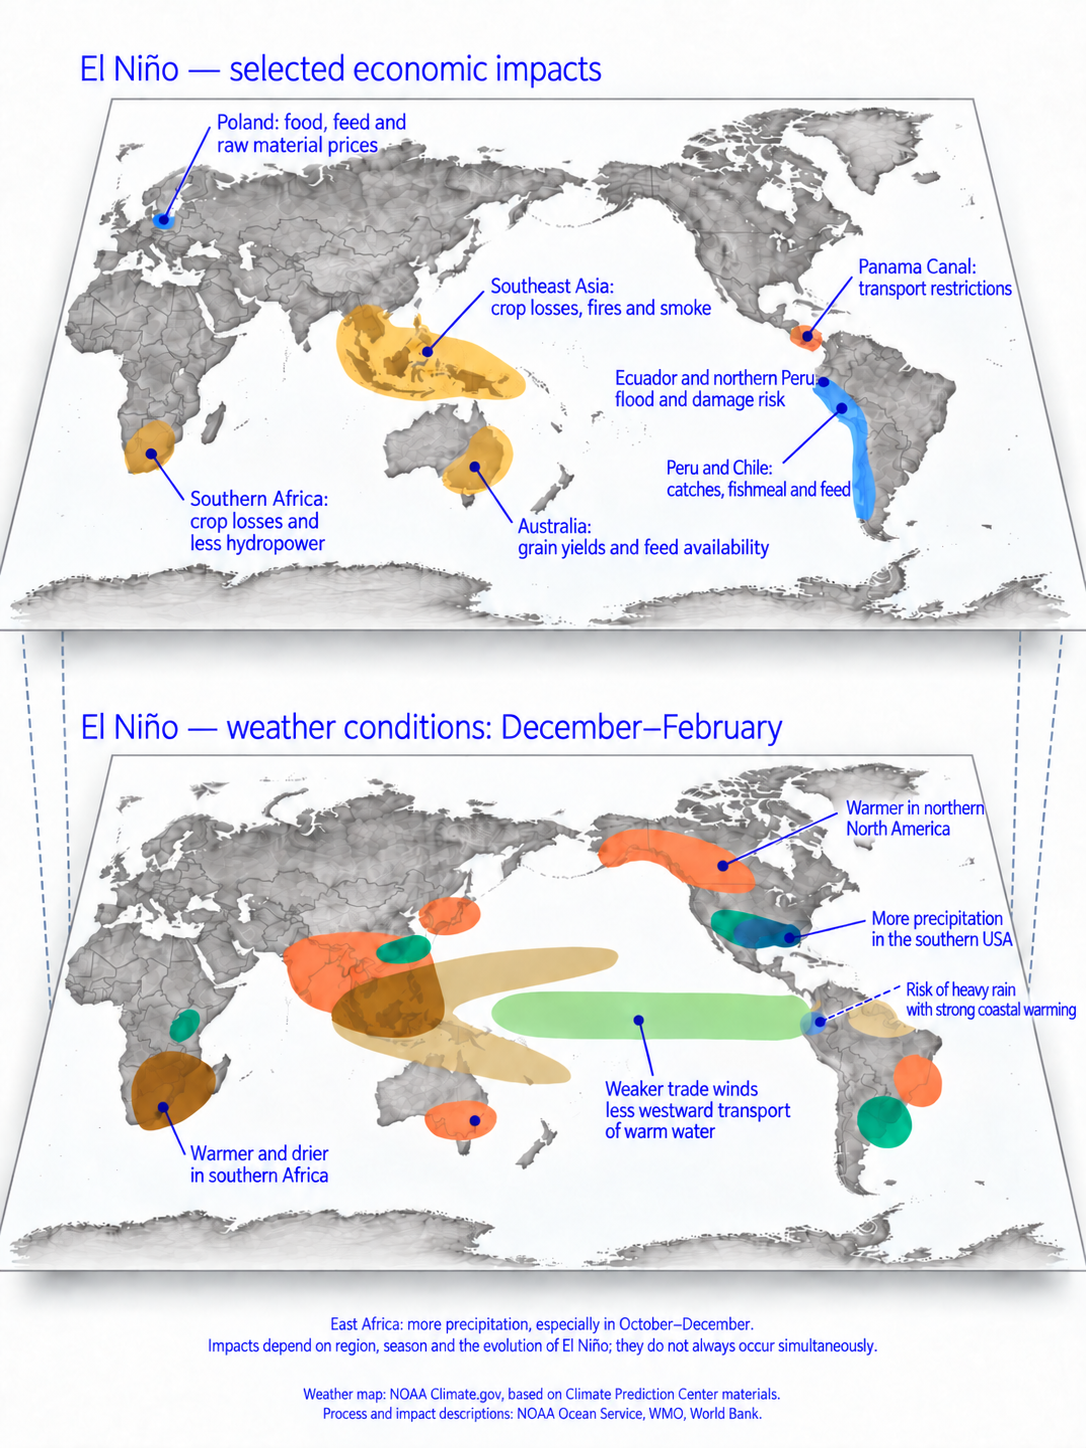
El Niño’s influence extends beyond the tropical Pacific. Links between atmospheric changes in distant parts of the world are called teleconnections. During El Niño, the shift in intense convection and rainfall over the Pacific changes atmospheric heating. The resulting disturbances propagate through the atmosphere and affect circulation far from the tropics, including the position of jet streams and storm tracks.
In this way, changes in the tropical ocean can affect temperature and rainfall on other continents. These global teleconnections depend on the season and the state of the ocean and atmosphere.
The diagram links selected economic effects of El Niño (upper map) with meteorological conditions in December–February (lower map). It shows weakening trade winds, regional rainfall changes and possible consequences for agriculture, fisheries, transport and energy. Effects depend on the region, season and evolution of the episode; they do not always occur simultaneously.
Indonesia and Sumatra: a regional example of teleconnections
Indonesia is an example of a region where ENSO-related circulation changes affect rainfall. El Niño often favours drier conditions there. Regional impacts also depend on local weather and conditions on land.
Indonesia: fires, smoke and supply continuity
In a comment dated 1 September 2026, Dariusz Baranowski, a scientist at the Institute of Geophysics of the Polish Academy of Sciences who had recently returned from meteorological fieldwork in Sumatra, drew attention to fires in Borneo and eastern Sumatra and their possible economic consequences:
According to his account, large fires were already burning in Indonesia, mainly in Borneo and eastern Sumatra. Smoke had reached Malaysia, although not yet Singapore.
Peru: a warm ocean, floods and changes in fisheries
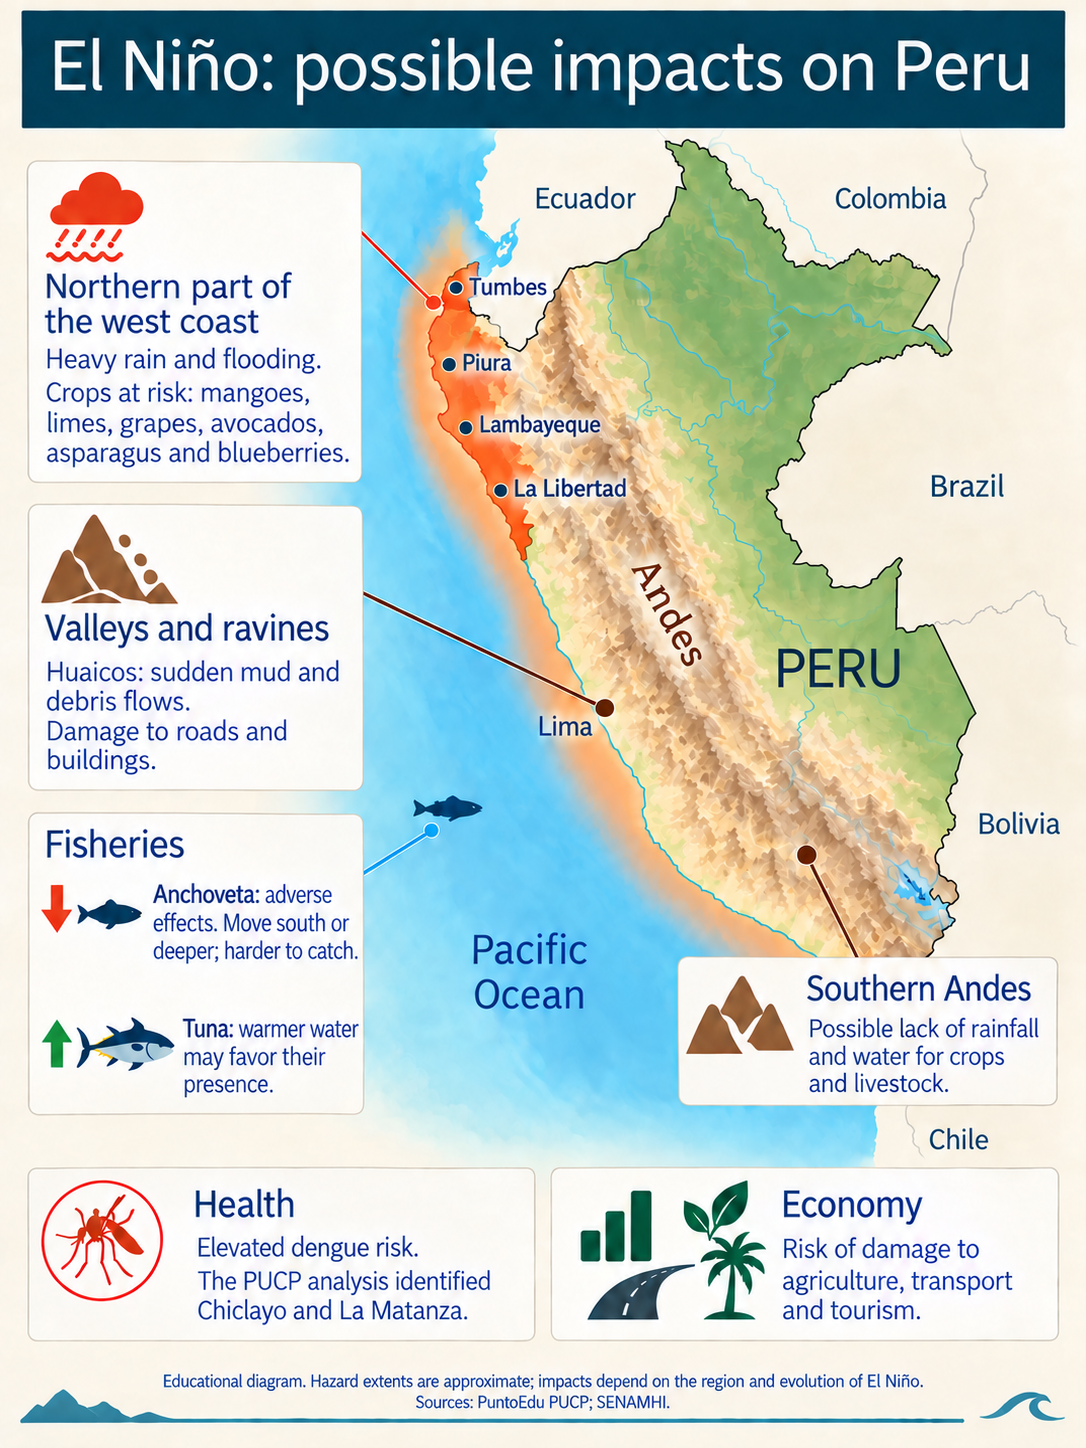
On the other side of the Pacific, El Niño changes living conditions in Peru. In the northern part of the country’s western coastal region, heavy rain can cause floods, destroy crops and damage roads. Valleys and ravines are threatened by huaicos—rapid flows of mud and rocks. Meanwhile, the southern Andes may face too little rainfall and insufficient water for crops and livestock. Warmth and water accumulating around homes favour mosquitoes that transmit dengue.
The changes also affect the ocean. Peruvian anchoveta may move south or into deeper, cooler water, becoming harder to catch. This reduces the availability of raw material for fishmeal and fish oil. Warmer water, by contrast, may favour tuna. El Niño’s effects therefore depend on the region, species and evolution of each episode.
ADDITIONAL MATERIAL
How El Niño affects fisheries off Peru and Chile
Upwelling brings water from deeper ocean layers towards the surface. Along the coasts of Peru and Chile, winds blowing along the shore, together with the Coriolis effect, drive surface water offshore. Cooler water from below replaces it. This water supplies nutrients to the upper ocean, supporting phytoplankton—the foundation of the food web for fish and other marine organisms. During El Niño, the thermocline in the eastern Pacific deepens. Water reaching the surface can then be warmer and poorer in nutrients, even if upwelling continues. Fewer nutrients limit phytoplankton growth and food availability. Fish may move towards cooler water, while prolonged food shortages impair their growth and reproduction. Declining catches can therefore reflect both fish moving away from fishing grounds and a reduction in their abundance. This mechanism connects oceanography with the economy: reduced anchoveta availability can lower fishmeal supplies and raise feed costs. Temperature, nutrient supply and the response of the whole food web all matter.
El Niño, the NAO and weather in Europe
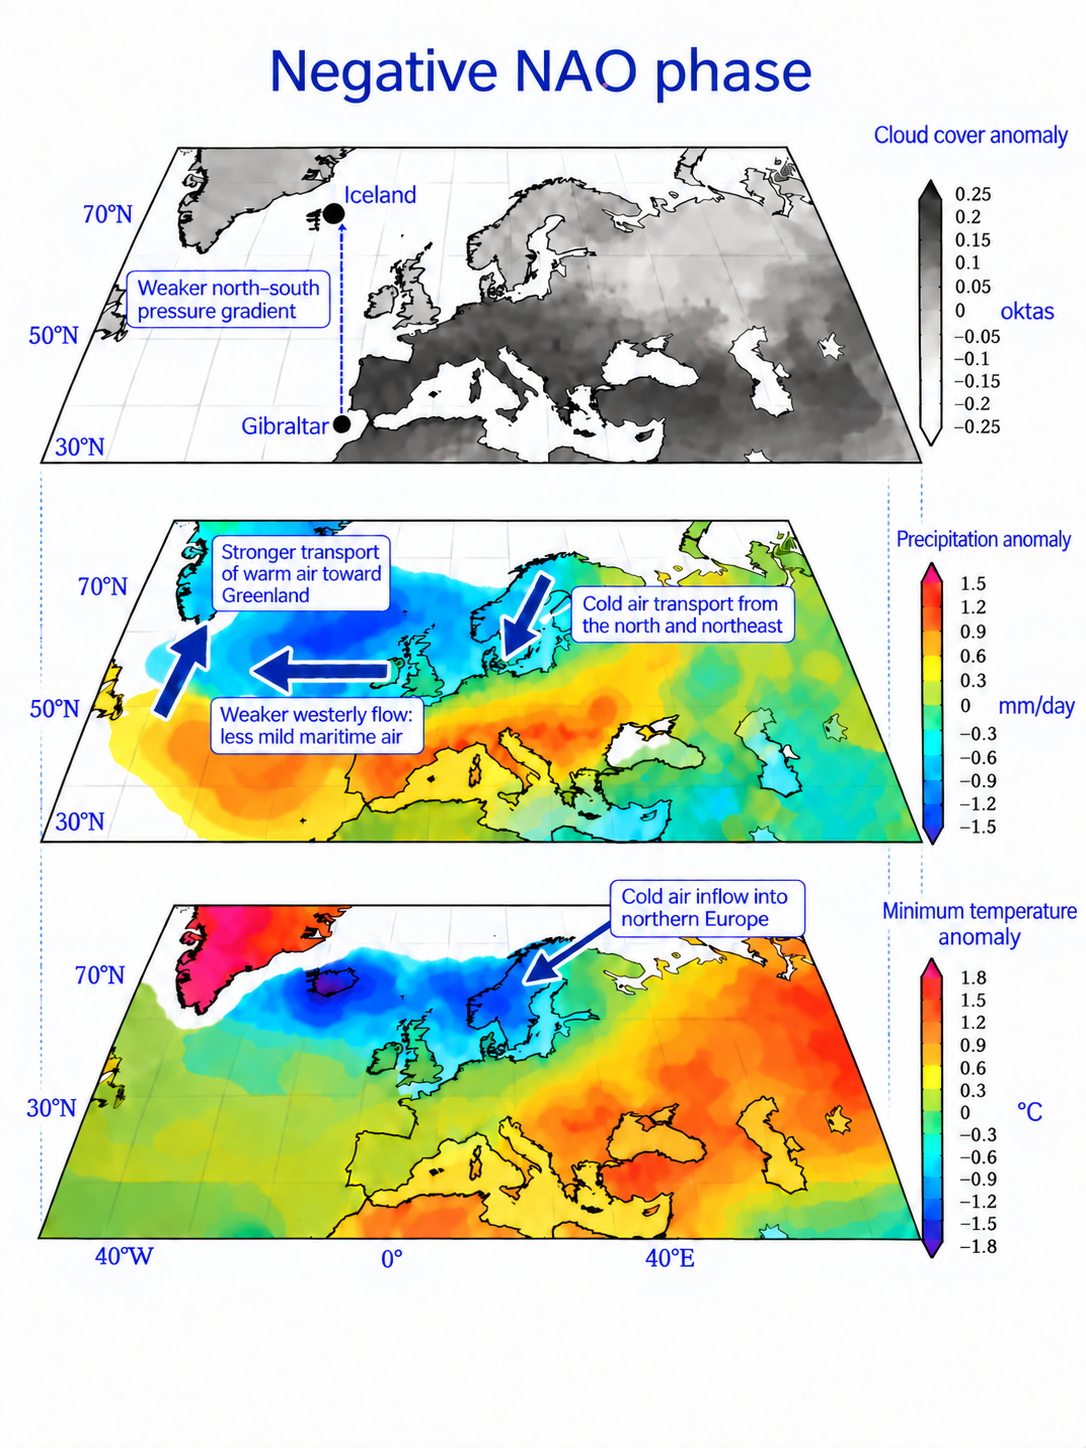
The North Atlantic Oscillation (NAO) describes changes in the pressure difference between the high-pressure area near the Azores and the low-pressure area near Iceland. This pattern affects the strength of westerly winds and the tracks of low-pressure systems moving from the Atlantic towards Europe. In the positive NAO phase, the pressure difference is larger and maritime airflow is usually stronger. In winter, this favours mild, windy and rainy weather in northern Europe, while southern Europe more often stays dry. In the negative phase, the pressure difference decreases and westerly flow weakens. Cold spells become more likely in northern and central Europe, and storm tracks may shift southward, bringing more rainfall to the Mediterranean region.
El Niño can influence this Atlantic pattern from the distant Pacific. One pathway runs through the stratosphere, the atmospheric layer above the one in which most clouds and weather form. El Niño can strengthen large-scale atmospheric waves that reach the stratosphere and weaken the polar vortex—the belt of strong winds surrounding the Arctic. These changes can then affect circulation closer to the surface, altering winds and storm tracks over the Atlantic.
The influence described here is most apparent towards the end of winter. The circulation pattern can then resemble a negative NAO phase, favouring colder conditions in northern Europe. However, a stronger El Niño does not necessarily mean stronger cooling in Europe. The most intense episodes can produce a different circulation response from moderate episodes. When discussing 2026, too, El Niño’s strength alone is not enough to predict winter in Poland: the response of the stratosphere and the atmosphere over the Atlantic also matters.
The economic consequences of El Niño
In “El Niño Is Taking Aim at Global Economy”, published on 1 September 2026 in The Wall Street Journal (WSJ), Ed Ballard and Costas Paris describe how El Niño affects fisheries, agriculture, transport, mining and energy. They show how changes in weather and ocean conditions translate into commodity supplies, production costs and companies’ ability to operate.
One example is fishing off Peru, where changing ocean conditions can reduce the availability of fish. Lower fishmeal supplies put pressure on feed and aquaculture costs. The authors also describe the other side: opportunities for producers of alternative proteins, including insect-based products. Drier conditions can harm crops in parts of Asia, while extra rain can help elsewhere. The season, crop development stage, irrigation and stocks all matter. Not every crop or country suffers the same losses. The Panama Canal needs fresh water to operate its locks. A rainfall deficit in its catchment can reduce capacity and increase shipping costs, allowing a regional drought to affect intercontinental supply chains. Mining is vulnerable both to water shortages and excessive precipitation. WSJ describes disruptions at a Chilean copper mine associated with heavy snowfall. Infrastructure and preparedness also influence the scale of the consequences. A milder winter can reduce heating demand, but gas prices also depend on inventories, supplies and market decisions. El Niño generally tends to suppress Atlantic hurricane activity, although it does not rule out a destructive season or an individual hurricane. Potential benefits in one region coexist with losses in others.
ADDITIONAL MATERIAL
Tropical meteorology in investment — Citadel
Knowledge of tropical meteorology also has applications in investment. Citadel, an investment management firm, employs atmospheric scientists in its commodities team. They analyse both short-lived weather events and the seasonal effects of El Niño. Their forecasts help assess opportunities and risks in energy and agricultural markets. According to eFinancialCareers (10 August 2026), Citadel hired a 20-person team in 2018 from Cumulus, a fund specialising in weather-related investments.
ENSO and the city’s heating budget
References and sources
- NOAA Climate.gov, El Niño and La Niña: Frequently Asked Questions — ENSO mechanisms and impacts.
- NOAA Climate.gov / Climate Prediction Center, maps of global El Niño and La Niña impacts in December–February, 2025.
- Climate Reanalyzer, University of Maine, daily sea-surface temperature in the Niño 3.4 region — a chart based on NOAA OISST v2.1 data.
- earth.nullschool.net — a visualisation of sea-surface temperature anomalies and ocean currents.
- Piotr J. Flatau, How and why we measure ocean temperature — direct measurements, Nauka o klimacie — shipboard measurements and bucket illustrations.
- Baranowski and colleagues, a study of the meteorological conditions associated with floods in Sumatra, Nature Communications, 2020.
- Ed Ballard and Costas Paris, El Niño Is Taking Aim at Global Economy, The Wall Street Journal, 1 September 2026, p. A2 — economic impacts.
- NOAA Science On a Sphere, EarthNow: Effects of El Niño and La Niña on Phytoplankton and Fish — upwelling, nutrients and fisheries.
- Citadel, What We Do — Taking Weather Prediction to a New Level — atmospheric scientists and the use of forecasts, including El Niño, in investment.
- Sarah Butcher, It's hot. So are people who can help hedge funds predict the weather, eFinancialCareers, 10 August 2026.
- Met Office, Factors that influence UK winters — the NAO and its influence on winter weather.
- Adam A. Scaife, Impact of ENSO on European Climate, ECMWF seminar materials, 6–9 September 2010, pp. 83–91, especially pp. 85 and 87–89 — links between El Niño and the NAO, the role of the stratosphere and effects on Europe.
- Ricardo M. Trigo, Timothy J. Osborn and João M. Corte-Real, The North Atlantic Oscillation influence on Europe: climate impacts and associated physical mechanisms, Climate Research 20, 9–17, 2002 — the basis for the negative-NAO schematic (Figures 4b, 5b and 6b).
- PuntoEdu PUCP, ¿Qué tan preparados estamos para el fenómeno de El Niño?, 12 August 2026 — possible impacts on Peru.
- SENAMHI, Escenarios de lluvias asociados al fenómeno El Niño — regional differences in rainfall across Peru.
- Ministerio de Educación del Perú, Gestión del Riesgo de Desastres — a description of mud-and-rock flows (huaicos).
- WHO, Dengue — dengue and conditions that favour its transmission.
- William M. Gray (1984), Atlantic Seasonal Hurricane Frequency. Part I: El Niño and 30 mb Quasi-Biennial Oscillation Influences, Monthly Weather Review, 112, 1649–1668.
- Philip J. Klotzbach and colleagues (2017), The Science of William M. Gray: His Contributions to the Knowledge of Tropical Meteorology and Tropical Cyclones, Bulletin of the American Meteorological Society — a review of Gray’s contributions and subsequent research.
- NOAA Physical Sciences Laboratory, NOAA OISST v2.1 — SSTA, 1971–2000.
- NOAA Physical Sciences Laboratory, NCEP Global Ocean Data Assimilation System (GODAS) — ocean temperature and the 20°C isotherm.